Friday 28 March 2014

FirstRes vs Bumitama vs TSH

After screening through 10 plantation companies with high potential of growth, I finally come out with 3 companies that I like, which are First Resources, Bumitama & TSH.

To know why am I choosing these three companies, you can refer to Part 1 and Part 2 of Plantation Companies With Best Growth Potential.

I know that there may be other plantation companies which are actually better than these three, or some other companies with even higher percentage of immature trees such as MKH and Innoprise etc. There may be also many other good ones listed in Indonesia.

However, I'm not expecting that I can pick up the best from the market. I just study a few of them. As long as it is good enough to meet my selection criteria, I'm ready to bear the outcome of my investment, no matter it is a good or bad decision.


In order to pick one out of three, I have to compare them head to head. Unfortunately, I can't get a lot of information for TSH.

TSH's annual reports and websites are not "investor-friendly" at all, in which some important plantation productivity data such as historical FFB yield, OER etc are missing.


First, lets compare the total planted area, FFB, CPO & palm kernel production of these 3 companies.


Though to me Bumitama is more like a newcomer and First Resources is quite an "established" company in plantation industry, their total planted area are actually quite close and also increase at almost similar rate yearly. 

As we will see later, the much lower revenue and profit for Bumitama is mainly due to less percentage of mature trees (less FFB produced) and less superior margin.

TSH is much smaller in term of total planted area.


Bumitama actually has more immature plantation area in hectare compared to First Resources. The immature area makes up 32% of its total planted area. Furthermore, its young mature trees below 7 years old at 43% makes Bumitama a more likely candidate for exponential growth in the next few years.


Both First Resources and TSH have huge unplanted land, which can sustain the companies' growth for many years to come. Bumitama has less but still quite a big number of unplanted land at 60,000ha. If it carries out ~10,000ha new planting a year, it can still last for a good 6-7 years. Anyway, the planned new planting for Bumitama in FY2014 is 8,000ha.


Without surprise, First Resources has the highest number of FFB produced due to its larger mature plantation. However, it is noteworthy that Bumitama's line is slightly steeper than the other two, which means Bumitama's FFB production grows slightly faster.


Bumitama achieves higher 4-Year CAGR (compound annual growth rate) in total planted area & FFB production compared to First Resources. Thus, Bumitama grows faster than First Resources from 2009 to 2013, especially its FFB production which achieves 30.5% 4Y-CAGR.

TSH's FFB also grows at 4Y-CAGR of 24.2% but I don't have its figure for total planted area.


Similar to FFB production, Bumitama's CPO production seems to grow at a faster pace compared to First Resources.


Palm kernel production grows in more even pace between the two.


First Resources has the largest palm oil mill capacity at 4.05mil tonnes per annum in 2013, besides also having downstream refinery facilities which contributed 9% of its total EBITDA in FY2012. Its newly constructed integrated processing complex at Riau even has a private jetty.

Both Bumitama and TSH are pure upstream plantation players.


Next, lets look at the efficiency of these companies in term of their plantation management.


The FFB yield of First Resources and Bumitama fell in FY2013 ended 31st Dec 2013, mainly due to biological tree stress. However, Bumitama seems to suffer less and was improving year by year before 2013.

Even though Bumitama's FFB yield figures are not high over 20, they are considered quite impressive as they are achieved from very young trees with weighted average age of just around 6 years. First Resources weighted average tree age is about 8 years.

I don't have TSH's historical 5 years figure but TSH is generally well-known for its high FFB yield among its peers. Its year 2011 FFB yield stood at 24.9 MT/ha, which was the highest among the three. It was reported earlier this month that TSH's trees have a weighted average age of about 8 years.


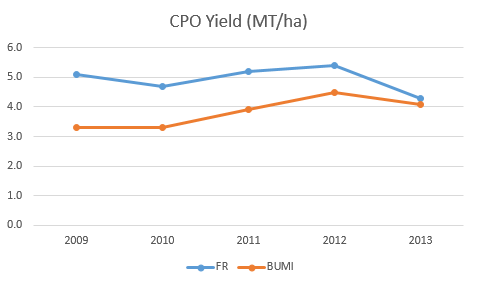
First Resources's CPO yield is not excluded from a fall similar to its FFB yield, so to Bumitama.


It is a surprise that Bumitama's OER has overtaken First Resources since year 2011. First Resources's OER seems to fall slowly throughout the past 5 years.


Kernel extract rate remain flat for both First Resources and Bumitama.

Since CPO price was depressed from mid 2012 to 2013, it is good to see how did it affect the companies' revenue and profit. The gross margin and net profit margin also show how efficient these companies are managed.


It is quite surprising that TSH's revenue in 2009 (RM980mil) was higher than First Resources and Bumitama, as its FFB production is only half of the latter and way way below the former in 2009. 

Actually TSH has contribution from other businesses such as cocoa, timber and wood products. Its revenue from sales of palm products in 2009 was actually RM770mil, but this was still more than First Resources (RM722mil) & Bumitama (RM414mil).


Anyway, TSH's revenue was almost flat around RM1 billion from 2009 to 2013, while both First Resources and Bumitama achieved persistent growth in revenue. 

First Resources's revenue seems to grow faster than Bumitama. This might be due to the effect of locked-in CPO forward sales at a high average selling price of RM2850/MT throughout year 2012-2013. Bumitama should also have its own locked-in CPO forward sales, but analyst did not point this out so I think it might not be that significantly high. The CPO average selling price for Bumitama in 2013 is estimated to be RM2500/MT only.


Thanks to its extraordinarily high margin, First Resources enjoys much higher net profit compared to Bumitama & TSH. 

The PATAMI presented here is WITHOUT the gain in biological assets value for First Resources and Bumitama. Other than the dip in 2010, Bumitama achieves a decent growth in PATAMI.

It is important to note that there is a special one-off gain amounting to RM85.3mil in TSH's FY13Q3 profit through disposal of stake in Pontian United. However, it also suffered a forex loss of RM43.7mil in the same period.

However, TSH's overall FY13 core profit of RM140.2mil, which is only slightly lower than its reported PATAMI of RM153.1, still beats consensus estimates.

All three seem to weather the period of low CPO price quite well with their growing FFB production.


Overall from 2009 to 2013, First Resources and Bumitama have the same growth in revenue, but Bumitama beats First Resources in PATAMI growth.


Even it drops a bit for the past 2 years, First Resources's gross margin is still far superior than the others. Bumitama's gross margin is flat while TSH improves significantly in year 2013.

Lastly, lets compare their debt level and ROE.


It is clear that First Resources is able to control its debt well, while both Bumitama and TSH have almost similar net debt/equity ratio in 2013. However, with the expectation of more profit due to higher FFB production and CPO price, the gearing ratio is expected to ease in coming years.

Anyway, all three will still carry out quite aggressive new planting and acquisition, which may need lots of capex.


First Resources undoubtedly has the highest ROE which is improving from year to year. Bumitama and TSH are also excellent at around 15. Profit arising from fair value gain in biological assets is excluded in  the calculation of ROE here.

I think that First Resources's earning will still grow in the next few years, but there is a concern that it might not grow as well as the other two even though CPO price is trending up. I predict Bumitama and TSH to have better earning growth and thus better share price appreciation.

Nevertheless, First Resources is currently trading at lower PE ratio compared to the other two. So this may somehow make all of them equally attractive to investors at the moment.


About which one to choose, I think three of them have their own plus and minus. If you are more conservative, then can go for more established & "stable" First Resources. If you want more growth, then can go for either TSH or Bumitama. 

Bumitama has more percentage of young mature trees but less percentage of immature trees compared to TSH. It also has better margin and growth story. Both companies' gearing ratio and ROE are quite similar in 2013.

However, TSH should have better FFB & CPO yield compared to Bumitama. Also, don't forget its Wakuba ramet planted commercially since 2012. Research shows that it can improve the yield (and thus, profit) substantially.

In conclusion, First Resources, Bumitama & TSH Resources are all good.

It is important to note that the Indonesian government has passed a new regulation in Oct 2013 which restricts oil palm planters to no more than 100,000ha of plantation in the country. Those who already have plantation land more than 100,000ha now are allowed to plant more than 100,000, but will not be able to buy further land for new planting. 

This will surely affect many plantation companies negatively especially those with more than or close to 100,000ha oil palm plantation but with very limited land reserved for new planting. However, those overseas companies who still yet to venture into Indonesia may benefit from it as there will be less competition.

Thus, those affected companies may look elsewhere to further expand their plantation. They may move to Papua province which they can have plantation area up to 200,000ha, or pursue new planting in other countries such as Papua New Guinea and Africa.

In this circumstances, I think those companies with good management and comfortable gearing may have the upper hand in future growth.

Monday 24 March 2014

Plantation Companies With Best Growth Potential (Part 2/2)

At least for me, it is not easy to value a plantation company.

Since most companies' financial year end in December, at this time we can get their latest PE ratio for direct comparison.

However, I think current actual PE ratio does not show or predict the true value of plantation stocks, as the most important factor to value them is their future growth in earning, which are linked to FFB growth and future CPO price.

CPO price might not be easy to predict, but FFB growth is largely predictable.

If we have detail palm age profile or yearly new planted area, then we can roughly calculate the future FFB production base on historical FFB yield per hectare for certain tree age groups. 

So, companies with high PE ratio because of poor earning at the moment may see their earning suddenly jump tremendously due to substantial increase in FFB production, as majority of trees enter prime age.

As stated in Plantation Companies With Best Growth Potential (Part 1), companies with the largest percentage of immature & young trees below 7 years are as follow:


       Chart 1: Companies With The Most Young & Immature Trees


I think it is still useful to look into the latest PE ratio of those 10 plantation companies. All companies' PE ratio shown in the table below are the latest with FY end in December, except IJMP (Mac) & JT (Jun).

Table 1: PE Ratio

PE Ratio
FR 13.4
TA 17.3
TSH 18.7
BUMI 19.7
IJMP 24.4
THP 28.0
SOP 29.3
TDM 30.0
GENP 35.0
JT 113.8


From the table above, JT might have a sky high PE ratio. However, it also has the highest FFB growth potential with the highest percentage of young & immature trees.

Both TSH and BUMI have relatively low PE ratio below 20x, and they also possess the highest percentage of young trees after JT. Thus, it seems like TSH and BUMI are the better bet at the moment.

FR has the lowest PE and decent percentage of young trees at 58.8%. It definitely looks good as well but why the market gives it a lower PE compared to its peers? There is a reason behind it.

There is another method to value a company which is Enterprise Value Multiple (EVM). It is calculated as EV/EBITDA. It roughly shows how many years it would take to pay off the acquisition cost if the company is to be acquired at enterprise value. Similar to PE ratio, the lower the better.


Table 2: EV/EBITDA
RM mil EV EBITDA EV/EBITDA
FR 13085.1 1121.3 11.7
BUMI 6054.7 425.8 14.2
GENP 8185.4 373.1 21.9
TSH 3737.2 224.7 16.6
JT 3539.2 144.6 24.4
SOP 3296.7 250.0 13.2
THP 3015.3 169.9 17.7
IJMP 2938.8 *159.5 *18.4
TA 1877.6 155.9 12.0
TDM 1557.9 96.1 16.2

* EBIT only

From calculation of EVM, FR still has the lowest or best value. Besides, SOP, TDM & THP also looks better compared to their relatively high PE ratio. JT still has the highest numbers, but not as high as its PE due to its high depreciation and amortization in FY2013.


With limited information on hand, I'm unable to calculate the estimated FFB production and earning of these companies in the future. However, those professional analysts can.

Below are the current price and latest target price by analysts for these 10 companies. For consistency, I will quote the target price given by RHB as RHB covers most of these stocks. All the target price are derived after the release of company's latest financial results.


Table 3: Target Price & Potential Upside
Stocks Actual Price Target Price Analyst Potential Upside (%)
FR 2.33 2.70 MB 15.9
TA 4.28 5.00 RHB 16.8
TSH 3.16 3.19 RHB 1.0
BUMI 1.05 1.39 RHB 32.4
IJMP 3.3 3.80 KNG 15.2
THP 1.99 2.10 MIDF 5.5
SOP 6.5 7.04 RHB 8.3
TDM 0.93 1.04 RHB 11.8
GENP 10.5 11.20 RHB 6.7
JT 2.73 2.95 RHB 8.1


       Chart 2: Potential Upside of Share Price    


JT and TSH are thought to have exponential growth in the future, but the potential upside of their share price are just 8.1% & 1.0% respectively. However, this target price is for calendar year 2014, which means it has limited upside for this year only. In the next few years, "barring any unforeseen circumstances", both companies' FFB production and profit will go up substantially and their target price will be revised upwards.

Many investors have already taken position in some hot and great plantation stocks. This results in their relatively high share price with limited upside at the moment. For long term investors, the target price by analysts might not be that important.

Anyway, it is still desirable to find one with high potential upside in year 2014. Obviously there is one here, which is Bumitama. 

In term of NTA (net tangible assets), most companies' share prices are 2-3 times more than their NTAs. Only TDM which is not a pure plantation stock has share price closest to its NTA.


Table 4: NTA

Price NTA
FR 2.33 0.80
TA 4.28 2.72
TSH 3.16 1.19
BUMI 1.05 0.39
IJMP 3.3 1.60
THP 1.99 1.35
SOP 6.5 2.82
TDM 0.93 0.84
GENP 10.5 4.52
JT 2.73 1.80


Fundamental investors always look for companies with high ROE. Higher ROE means higher profitability in which the company can generate more profit from its shareholders fund.

Besides ROE, it is also important that the gearing is at a comfortable level. The lower the gearing, the less risky it is when unforeseen disaster strike the company or plantation industry.


       Chart 3: ROE and Gearing


First Resources has excellent ROE at 21.8%, while Bumitama and TSH also meet my selection criteria of around 15 and above.

It is obvious that those companies with high percentage of young trees through aggressive new planting in recent years have the highest net debt/equity ratio. If you own those companies with high gearing ratio, then better pray that their FFB production grows according to plan and no unforeseen circumstances strike within the next few years.


Personally I hope to own a pure plantation company but TA, JT, GENP, SOP & TDM are not. 

If not mistaken, only First Resources and SOP are involved in downstream business with palm oil processing and refining facilities. This is a plus point for me.

In summary, there is no "the best" plantation stock.

However, the one that caught my eyes is Bumitama, which stands out in all aspect except its lower FFB yield, slightly higher PE ratio and high gearing.

First Resources is also not bad at all with its excellent management (high ROE, low gearing with unbelievable margin), low PE ratio or EVM and more than 50% of young & immature trees. 

The worries for First Resources are the recent significant fall in FFB yield and also the expiry of its locked-in CPO forward sales at a high average selling price of around RM2850 throughout year 2012-2013. So, FR will depend more on its FFB production growth to drive up its revenue and profit in 2014, not the CPO price.

This may explain why the market gives FR a lower PE as the growth in profit for 2014 might be only a little or negative.

Anyway, I think FR is still a superb plantation stock to own in long term.

For Malaysia's side, I think I will go for a pure plantation company with high percentage of young trees, if I were to invest in one.

Friday 21 March 2014

Scientex's Best Ever Quarter!

Scientex FY14Q2 Financial Result

SCIENTEX (RM mil) FY14Q2 FY14Q1 FY13Q4 FY13Q3 FY13Q2
Revenue 383.5 364.8 371.2 345.1 271.1
PBT 44.4 37.8 40.2 38.2 33.2
PBT% 11.6 10.4 10.9 11.1 12.2
PAT 33.9 29.3 30.3 29.5 25.6


Manu Rev 288.5 289.2 277.4 275.3 193.5
Manu OP 15.9 17.7 20.6 16.7 11.1
Prop Rev 95.0 75.6 93.8 69.8 77.6
Prop OP 29.3 22.2 31.4 23.3 23.0


Total Equity 649.9 635.9 628.7 584.8 557.2
Total Assets 1304.4 1263.1 1286.4 1180.9 1172.2
Trade Receivables 251.7 209.7 195.5 211.1 194.3
Inventories 76.3 86.0 80.7 73.5 92.5
Cash 89.3 91.2 152.2 58.6 50.8
Prop Dev Cost 74.4 57.5 68.5 56.4 52.8


Total Liabilities 633.3 606.8 637.7 577.6 577.3
Trade Payables 214.2 229.4 258.4 221.3 212.3
ST Borrowings 205.8 167.9 167.6 143.8 126.0
LT Borrowings 163.7 164.3 167.8 168.4 196.3


Net Cash Flow -62.9 -61.0 115.8 22.3 14.5
Operation 30.9 13.5 209.7 131.4 79.4
Investment -67.0 -54.1 -345.0 -325.2 -293.4
Financing -26.8 -20.4 251.2 216.1 228.5


EPS 15.34 13.27 13.80 13.73 11.90
NAS 2.94 2.88 2.84 2.72 2.59
D/E Ratio 0.43 0.38 0.29 0.43 0.49


Scientex latest financial performance is better than what I expect.

Its quarterly revenue and net profit of RM383.5mil and RM33.9mil respectively, are 41% and 32% better than the corresponding quarter a year ago.

In fact, it is the highest revenue, profit before and after tax Scientex has ever achieved in its history.

This record-breaking feat in current quarter is helped by better contribution from its property arm, while manufacturing segment remains flat.

However, I expect its manufacturing segment to contribute more in the future from higher demand of its products and increase in production capacity.

       MD: Mr Lim Peng Jin


Scientex has completed the acquisition of Seacera Polyfilms on 13 Feb 2014. However, its immediate contribution to Scientex's bottom line is expected to be small. I will be happy if it can give a net profit of RM1mil in its first year.

Other than this, Scientex's expansion plan is largely on track in which its 50% capacity upgrade in blown film lines is expected to be fully operational by mid 2014.

As at 31 Jan 2014, Scientex's borrowings has increased RM37.3mil while cash level falls slightly compared to 3 months earlier. Thus, net debt/equity ratio increases to 0.43 from 0.38 earlier.

This is not a worry because traditionally Scientex is capable of generating strong operation cash flow.

       The Heights Residence, Malacca


With first half net profit of RM63.3mil, I'll keep my previous target price of RM6.26 base on FY14 full year net profit of RM120mil and PE of 12x.

Scientex has updated and improved its official website. Nice one indeed.

Looking at the quality of its current and future property development, which are very attractive and presentable, I think Scientex will not have much problem selling them even in the time of property market slowdown.

The Heights Residence, the first of total 6 blocks of condominiums in Malacca launched late last year, is said to achieve excellent sales. The project is within walking distance from MMU and thus should be a hot project. 

Even though the potential upside of its share price seems limited to me, I'll still hold Scientex's shares just to be part of this great growing company, apart from enjoying its decent dividend.

Some photos of Scientex Skudai development: