Tuesday, 27 October 2015

Huayang: Ready To Buy More Land

Huayang FY16Q2 Financial Result

Huayang (RM mil) FY16Q2 FY16Q1 FY15Q4 FY15Q3 FY15Q2
Revenue 150.6 142.6 152.1 155.5 139.5
Gross Profit 50.3 51.5 53.2 59.3 45.2
Gross% 33.4 36.1 35.0 38.1 32.4
PBT 38.2 40.2 42.5 43.2 35.2
PBT% 25.4 28.2 27.9 27.8 25.2
PAT 28.7 29.9 29.7 30.9 26.0


Total Equity 524.4 495.8 465.9 449.4 436.9
Total Assets 941.3 944.2 923.2 877.3 828.0
Trade Receivables 55.3 72.9 88.9 73.3 68.1
Prop dev cost 144.3 161.5 167.7 175.5 159.5
Inventories 19.8 10.5 9.9 9.8 9.8
Other Current Assets 201.3 200.7 189.6 180.3 157.0
Cash 76.1 62.6 40.9 44.1 43.9
Bank Overdraft 6.7 4.6 7.4 14.4 10.9


Total Liabilities 416.9 448.5 457.4 427.9 391.1
Trade Payables 129.5 135.1 141.5 118.2 120.4
ST Borrowings 75.3 78.1 78.6 82.2 75.9
LT Borrowings 170.8 195.4 192.1 187.4 161.0


Net Cash Flow 36.0 24.4 3.4 -0.5 2.7
Operation 81.9 25.6 115.9 71.1 58.1
Investment -22.0 -6.7 -86.6 -50.7 -23.9
Financing -23.9 5.6 -26.0 -20.8 -31.5


Dividend paid 0 0 44.9 31.7 13.2


EPS 10.87 11.32 11.25 11.72 9.84
NAS 1.99 1.88 1.76 1.70 1.65
D/E Ratio 0.34 0.43 0.51 0.53 0.47


Total sales 93.10 82.00


Unbilled sales 607.2 660.8 701.9 733.3 717.9


I expect Huayang's FY16 (ends on Mac16) net profit to at least match FY15's figure of RM110mil, if not better.

With RM58.6mil net profit in the first half of FY16, it is certainly on track.

However, poorer sales in the first half of FY16 does not do it any good.

Huayang manage to sell RM175mil worth of property so far this FY, despite the lack of new launch.

Its unbilled sales drop further to RM607.2mil as a result.

Its One South Cube & Zeta Residence have achieved take up rate of just 46% as of Sep15.

Its projects face a loan rejection rate of as high as 50%! This means that its sales can be much better if more buyers can get their loans approved like usual.

Anyway, it is good to hear that the management is still confident that its FY16 sales target of RM500mil can be achieved.

In order to do so, it should launch high GDV new projects in the second half of FY16.

These projects include Mines South with a GDV of RM368mil. It is expected to be launched in the last quarter of FY16 (Jan-Mac16).


       Mines South beside the lake


It is a surprise to me that Huayang is reported to have acquired 9.5 acres freehold land in Juru, Bukit Mertajam for RM21.7mil (RM52.50psf) in Aug15.

This land should be the land I wrote about in early September. I thought that was part of the land deal announced earlier in Jan15.

Now it looks like this is another new and latest acquisition.

Huayang might launch its project on this land sooner than expected.

It plans to build 90 units of landed gated properties and a 41-storey 268-unit medium cost condominiums which are estimated to carry a GDV of RM180mil.

Recently when I was driving along Jalan Baru, Perai, I noticed a familiar logo at the side of the road.

Guess what, it is Huayang's logo on a recently-completed business complex known as Frontage.

I think this should be Huayang's newly set up sales office in the northern region.

However, I'm disappointed that it is on the highest 4th floor, not the ground floor...

On its latest balance sheet, net debt/equity ratio has dropped to 0.34x which is the lowest in the past 2.5 years.

So, Huayang will continue its landbanking activity and the management expects at least one/more land deal in the second half of FY16.

Huayang paid 12sen (38%) and 13sen (30%) dividends respectively for its FY14 & FY15.

I expect at least 13sen for FY16 which translates into dividend yield of 7.0% at current share price of RM1.85.

For Huayang, we are not talking about growth in short to mid term. It's all about dividends now.

Monday, 26 October 2015

EPS Dilution - Warrants

While reading income statement in a financial report, we will see both basic EPS (Earning Per Share) and diluted EPS at the end of the report.

Basic EPS is simple, which is defined as:


Net profit attributable to shareholders
_____________________________

Weighted average numbers of ordinary shares


Average numbers of ordinary shares is used in the denominator because total number of shares may change in a given period of time.

If more shares are issued in that period (warrant conversion etc), total number of shares will increase.

If the company buy back its shares, total number of shares will decrease.

Calculation of the weighted average shares is a bit complicated. It is best explained with an example.

If company X starts year 2015 with 100,000 shares, issue additional 50,000 shares on 1st Apr15, and then buy back 20,000 shares on 1st Oct15, and end the year of 2015 with 130,000  shares, what will be its average outstanding shares for the whole year of 2015?

As company X has 100,000 shares for 3 months (1st Jan until 1st Apr), which is 25% of one year, its weight will be: 100,000 x 0.25 = 25,000

From 1st Apr to 1st Oct (6 months), company X has 150,000 shares. So the weight it carries in this period of time will be: 150,000 x 0.5 = 75,000

For the last 3 months from 1st Oct to 31st Dec15, company X has 130,000 shares outstanding. So the weight will be: 130,000 x 0.25 = 32,500

If we add up all 3 of them: 25,000 + 75,000 + 32,500 = 132,500, this will be the weighted average shares for company X in year 2015.


We know that when the company issue more shares, earning will be diluted and this is generally not a good news for existing shareholders.

In Malaysia, common securities that potentially dilute the earning are warrants, employee stock options (ESOS) & long term incentive plan (LTIP), convertible loans (ICULS) & convertible preference shares (RCPS).

While the dilution effect of ESOS is basically small, the "damage" from warrants and ICULS should not be overlooked.

For accounting purpose, company must display in its financial report the diluted EPS arising from existing securities which are convertible into ordinary shares.

To calculate the diluted EPS from warrants conversion, commonly "Treasury Stock Method" is used.

This method assumes that all the cash raised from the conversion of warrants will be used to repurchase (buy back) the company's shares and put them under treasury shares.

Treasury shares bought back will reduce the company's outstanding shares in the open market.

Just take Thong Guan as an example:

Thong Guan has about 105.2mil ordinary shares. It issued 26.3mil warrants in Sep14.

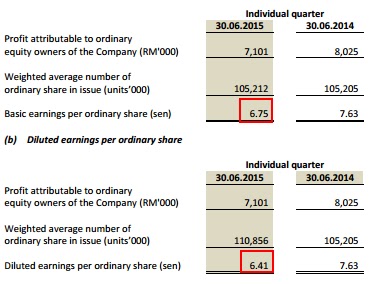
Below is Thong Guan's EPS in its FY15Q2 report ended 30 Jun 2015:


With PATAMI of RM7.101mil and weighted average shares of 105.2mil, Thong Guan's basic EPS is a straight forward 6.75sen.

We know that there are approximately 26.3mil warrants at this time which can be converted into one mother share each.

IF all warrants are converted to mother shares, total outstanding ordinary shares for Thong Guan will be 105.2 + 26.3 = 131.5mil.

So the diluted EPS should be 7.101 divided by 131.5 = 5.4sen right? This is my own way of calculating diluted EPS.

However, the diluted EPS stated in the report is 6.41sen, which is much higher than 5.4sen.

Lets calculate using the "Treasury Stock" method.

There are 26.3mil warrants with exercise price of RM1.50 each.

If all warrants are converted to mother shares in FY15Q2, Thong Guan will get RM39.45mil cash.

On 30th Jun15 which is the end of Thong Guan's FY15Q2, its share price closed at RM1.91 (might use average share price).

If all the cash raised are used to repurchase its ordinary shares from open market, it will be able to get 20.65mil shares.

So, there will be additional 5.65mil shares only after this convert & repurchase exercise (26.3mil - 20.65mil).

To calculate the diluted EPS, the total number of shares used is 105.2 + 5.65 = 110.85mil.

Thus, diluted EPS = 7.101 divided by 110.85 =  6.41sen.

Do you think this is a fair estimation of EPS dilution?

I don't think so.

In real life, we know that it is 100% impossible for a company to use 100% of the cash raised from exercise of warrants to buy back its own shares.

If the company do so, then what is the point of issuing warrants in the first place?

Even if the company does buy back its shares, the amount is usually small and negligible.

I think this "Treasury Stock" method seriously underestimate the EPS dilution effect so personally I won't use it.

Nevertheless, it is also not without flaw using my own way to calculate diluted EPS especially if the expire date of the warrants is still long and the company's earning may increase later.

Anyway, I tend to adopt the "worst case" scenario so I will stick to this at the moment.

Sometimes if a company has a bright future and gives attractive dividends, or the major shareholders want to strengthen their grip on the company, the warrants can be quickly converted into mother shares causing immediate EPS dilution.

For example Inari issued about 202mil of warrant-A in June 2013. Now (Oct15) there are only 9mil Inari-WA remaining in the market even though its maturity date is still long in June 2018. 

The rest of 193mil have been converted to Inari shares causing significant earning dilution to Inari.

However, this is not a big concern for Inari's shareholders as its earning was widely expected to improve tremendously.

In conclusion, diluted EPS from warrant conversion is calculated using the "treasury stock method". EPS dilution from ICULS will be calculated with different method though.

Sunday, 25 October 2015

Budget 2016 Highlights

MALAYSIA BUDGET 2016 Highlights


Budget allocation
  • 2016 budget allocates total RM267.2 billion, an increase from a revised allocation of 260.7 billion for 2015. The initial allocation for 2015 was 273.9 billion.
  • For 2016, federal government revenue collection is projected at RM225.7 billion, up RM3.2 billion from 2015.
  • The first priority of Budget 2016 is to spur domestic investment to contribute 26.7% to the GDP in 2016.
  • The Budget aims to increase private investment to RM218.6bil and public investment to RM112.2mil.
  • Subsidy allocations seen falling slightly to RM26.1 billion from RM26.2 billion this year. 


Taxes

  • Income tax increased from 25% to 26% for people earning between RM600,000 and RM1 million. Increased to 28% for those earning above RM1 million. 
  • Income tax relief for each child below 18 years of age is increased to RM2,000 from RM1,000 from year of assessment 2016.
  • Tax relief for individual taxpayers whose spouse has no income is increased to RM4,000 from RM3,000.
  • Children supporting their parents, even if not living together with their parents, to get tax relief of RM1500 (for the mother) and RM1,500 (for the father), if the parents are above 60 years of age.
  • Parents of disabled children get RM6,000 tax relief and another RM14,000 if their child furthers his or her studies.
  • Tax exemption of RM8,000 instead of RM6,000 is also set aside for every child above 18 years of age in an education institution, both local and overseas.
  • GST to increase government revenue by RM39 billion, versus RM27 billion in the first eight months of 2015. Some basic goods to be zero-rated, including over-the-counter drugs, baby milk, nuts based food, noodles.
  • The GST sum is to be credited into value of prepaid reloads from Jan 1 next year.
  • All domestic economy class flights will be exempted from GST for rural folk.

Expenditure
  • RM41.3 billion allocated to improve education.
  • Defence Ministry allocated RM17.1 billion.
  • Allocation of RM30.1 billion for development projects, RM5.2 billion for security, social development gets RM13.1 billion.
  • Majlis Amanah Rakyat, an agency to facilitate the development of ethnic Malays and other indigenous Malaysians, allocated RM3.7 billion.
  • RM100 million is to be provided by Communications & Multimedia Ministry for eRezeki, eUsahawan programmes which is expected to benefit some 100,000 people.
  • RM360mil is proposed to improve National Service, with RM160mil allocated for non-governmental organisations.
  • TEKUN to provide RM600mil + RM500mil for Bumiputras and RM100mil for Indian entrepreneurs.
  • RM90mil is allocated as micro-credit loans for small traders and Chinese entrepreneurs.
  • RM300mil is proposed to improve the welfare and development of the Orang Asli community. RM45mil is also set aside to assist with extra food, pocket money and school transport fees for the Orang Asli community.
  • RM930mil is allocated to the Youth and Sports Ministry, with RM145mil set aside for training athletes.

Subsidies and handouts
  • Spending allocation for Bantuan Rakyat 1Malaysia (BR1M), a programme providing cash assistance for low income households, will be raised to RM5.9 billion in 2016, up from an estimated RM4.9 billion in 2015.
  • The Government will allocate a BR1M payout of RM400 to unmarried persons above 21 with incomes below RM2,000. 
  • A BR1M payout of RM1,050 (for those with incomes below RM1,000), RM1,000 (for those with incomes below RM3,000), RM800 (for those with incomes below RM4,000).
  • From Jan 2016, RM100 will be given in schooling aid to students from households with a monthly income of RM3,000 and below.
  • RM250 1Malaysia book vouchers will be available for 1.2mil students.
  • A payment of RM500 for all civil servants and RM250 is allocated for Government retirees to help with cost of living.


Development
  • Affordable housing projects allocated RM1.6 billion, to be spent building 175,000 houses.
  • RM28 billion is allocated for new MRT projects.
  • RM900 million allocated to resolve Kuala Lumpur traffic congestion.
  • Telecommunications infrastructure allocated RM1.2 billion.
  • RM1.4 billion earmarked for development of rural roads nationwide.
  • Pan-Borneo highway to be toll free when completed in 2021.
  • Government to improve infrastructure in rural areas, including building houses and water supply.
  • RM5.3 billion allocated to modernize agricultural sector.
  • RM515 million allocated to improve electricity supply in Sabah state.
  • RM200mil will be allocated to improve roads in Felda settlements.
  • RM1.2bil is allocated to improve Internet speeds, from 5mbps to 20mbps.
  • RM67mil is allocated for bus operation routes outside the city.

Tourism
  • Government allocates RM1.2 billion to the tourism industry.
  • Tourism is expected to contribute RM103bil to the economy. 
  • E-Visa for seven countries (China, India, Myanmar, Nepal, Sri Lanka, United States and Canada) to be launched in mid-2016.

Oil project
  • Pengerang oil project to receive RM18 billion in 2016.

Minimum wage
  • Increased from RM900 per month to RM1,000 in peninsular Malaysia, from RM800 to RM920 in East Malaysia, starting from July 2016.
  • The minimum starting salary in the civil service is set at RM1,200 a month from July 2016. The move is expected to benefit some 60,000 civil servants.
  • From July 2016, the minimum pension rate is set at RM950 a month for pensioners with at least 25 years of service.

Source: The Star & Malaymailonline

Saturday, 24 October 2015

2015/2016 Economic Report

MALAYSIA 2015/2016 Economic Report

  • Goods and Services Tax (GST) to rake in RM39 billion in 2016 (3.1 percent of GDP) (2015: estimated RM27 billion from April).
  • Malaysia's GDP to remain on a steady growth in 2016, to expand between 4.0 percent and 5.0 percent (2015: 4.5-5.5 percent).
  • Growth in Malaysian economy to be driven by domestic demand with private expenditure to remain the main anchor.
  • Malaysia's fiscal deficit is projected to decline to RM38.8 billion or 3.1 percent of GDP in 2016 (2015: 3.2 percent).
  • Federal government revenue collection next year to grow marginally by 1.4 percent to RM225.7 billion, largely due to higher collection of tax revenue.
  • Oil-related revenue to drop 14.1 percent in 2016 due to lower global crude oil prices (2015: 19.7 percent).
  • The federal government expenditure to increase 1.7 percent to RM265.2 billion in 2016 (2015: RM260.7 billion).
  • Of the RM265.2 billion Federal government expenditure, 81.1 percent allocated for operating expenditure while 18.9 percent for development expenditure.
  • Operating expenditure in 2016 to increase marginally by 0.9 percent following continuous efforts to rationalise and optimise government spending.
  • The development expenditure is expected to rise 5.4 percent next year, of which RM30.3 billion would go to the economic sector.
  • The security sector would be provided RM5 billion in 2016 to enhance the capability of the armed forces and police.
  • A total of RM1.6 billion would be allocated next year for general administration sector for upgrading of government facilities nationwide.
  • Domestic demand is expected to register a growth of 5.5 percent this year driven by private sector spending.
  • Private investment to increase 6.7 percent in 2016 with the bulk of investment in the manufacturing and services sectors.
  • Private consumption is anticipated to expand 6.4 percent in 2016, benefitting from stable employment prospects and favourable wage growth.
  • Public investment to record a higher growth of 2.3 percent in 2016 from 1.6 percent expected this year supported by new projects under the Economic Transformation Programme and 11 Malaysia Plan and the ongoing projects under the 10 Malaysia Plan.
  • Services sector is projected to grow 5.4 percent in 2016 and increase its share to 54 percent of GDP from 53.8 percent this year with all sub-sectors continuing to expand.
  • Inflation to remain stable at two to three percent in 2016 (2015: 2.0-2.5 percent).
  • Nominal GNI per capita to increase 5.6 percent to RM38,438 next year from 4.2 percent anticipated growth to RM36,397 this year.
  • Malaysia’s current account to post a surplus in the range of 0.5 percent to 1.5 percent of GNI compared with a surplus of 1.5-2.5 percent expected this year.
  • Current account surplus in 2016 to be down more than half to RM11.3 billion from RM23.4 billion this year and RM47.3 billion in 2014.
  • Gross exports are expected to rebound 1.4 percent in 2016 from a 0.7 percent contraction this year, supported by higher public investment and capital spending in the manufacturing and services sectors.
  • Malaysia’s 2016 external position to remain encouraging in line with better growth prospects for regional and advanced economies, reinforced by steady expansion in the domestic economy.
  • The outlook for world trade is projected to improve next year.
  • The deficit in the services account next year is expected to improve to RM11.4 billion from RM14.7 billion this year.
  • The federal government debt remains within prudent limits, and is well capped at 55 percent to GDP, placing Malaysia among medium-indebted countries.
  • Offshore borrowings remained manageable at 1.6 percent of GDP, despite the appreciation of the US dollar.
  • Malaysia’s financial system remains strong this year despite heightened challenges, i.e declining commodity prices and weakening ringgit.
  • The East Coast Economic Region (ECER) has attracted RM78 billion in investments since its inception in 2007, accounting for 71 percent of the RM110 billion target by 2020.
  • Insurance and Takaful Industry performance remains resilient with strong capitalisation and improved profitability.
  • Trade surplus is expected to be higher at RM85.3 billion or 7.3 percent of gross domestic product (GDP) in 2015 (2014: RM82.5 billion; 7.5 per cent).
  • Government commits to improve and strengthen the Islamic financial market, as part of its strategies to develop and prosper the nation.
  • Agriculture to pick up in second half 2015 on higher palm oil, rubber output.
  • Asean to set up working committee to enhance financial inclusion.


Source: Bernama, https://www.malaysiakini.com/news/316911

Thursday, 22 October 2015

TGuan: Moving Up The Value Chain

In stock market investing, I like growth, especially when a small company grow into a big company.

Thong Guan seems to have the potential to be one of such companies.


TGuan, which is based in Sg Petani, is a small company with market cap of RM200mil (RM1.97 x 105mil shares).

It has 2 business divisions:
  • Plastic products manufacturing & trading
  • Food & Beverage manufacturing & trading

Its plastic products include stretch film (like Scientex), garbage bags, PVC food wrap etc.

Its F&B products are mainly tea & coffee marketed as "888" brand, and also some organic food.

TGuan was established way back in 1942 and was initially involved in distribution of coffee and tea. It ventured into manufacturing and trading of plastic products in the 1970s.

It was listed in 1997 on second board and was promoted to main board in 2002.

It was once the largest stretch film producer in Asia Pacific region. However, I think this title should belong to Scientex now.

Anyway, TGuan is still the largest manufacturer of PVC food wrap in Malaysia.


In year 2014, TGuan tabled a 3-year RM100mil expansion plan until 2016.

This aggressive capex aims to expand its plastic manufacturing division especially its stretch film and PVC food wrap .

CIMB Research expects TGuan's production capacity to increase by 40% from 120,000MT in early 2014 to 170,000MT per annum in 2016.

The initial plan laid out includes:
  • Install thin stretch film machines with in-line pre-stretching capability & edge-folding
  • Increase PVC food wrap production lines from 4 to 10 lines
  • Install 33-layer nano-tech stretch film line
  • Install its first blown film line
  • Setting up an R&D center

Before this capex plan in early 2014, TGuan already has:
  • 11 stretch film lines (9 in Malaysia, 2 in China) with annual capacity of 80,000 MT
  • Garbage bags lines with annual capacity of 40,000 MT
  • 4 PVC food wrap lines with annual capacity 6,000 MT

From TGuan's 2014 annual report, it is mentioned that TGuan has successfully installed the thin stretch film line in 2014.

At the same time, two additional PVC food wrap lines (5th & 6th) have also been added to increase its production capacity to 720 MT/month, or 8,640 MT/annum.

From its latest FY15Q2 quarterly report released in Aug15, it seems like the nano-tech stretch film line, blown film line and R&D center are still not in place.

Anyway, it has acquired organic noodles manufacturing facilities recently for its F&B division.

In 2016, it will continue to increase its PVC food wrap lines to 10 line with total production capacity of 15,000 MT annually.

Besides, I believe that it will also increase the production capacity of its thin stretch film gradually.


So, we know that PVC food wrap production will get an 150% rise in production capacity. How much net profit can it contribute to TGuan in the future?

This PVC food wrap business is a JV with a Korean company Power Wrap Inc since 2011. TGuan has 85% shares in it.


In FY14, TGuan's PVC food wrap division (TGPW) contributed RM32.8mil revenue and RM3.25mil profit to TGuan. 

Since the additional 5th & 6th lines were ready only at the end of year 2014, the figures above should be derived from 4 production lines.

This means that 150% increase in capacity can potentially raise the profit contribution from TGPW to RM8mil (should be operating profit).

As TGuan owns 85% of TGPW, it will work out to be around RM7mil.

Meanwhile, its stretch film capacity might also get some significant increase in capacity, especially the thin & nano-tech film which fetch higher margin.


In FY14, TGuan's PATAMI dropped 38% despite a slight increase in revenue.


The drop in profit is mainly due to forex loss and impairment of receivables etc which adds up to almost RM10mil.


Without these special items, TGuan's PATAMI should stay flat at around RM27mil since 2011.

With outstanding shares of 105.2mil, its "revised" EPS for FY14 should be 25.6sen.

At recent share price of RM1.97, it is trading at lowish PE of 7.7x.

I don't have any clue on how much profit its additional stretch film production can give.

If both PVC food wrap and thin stretch film can contribute an extra RM10mil net profit a year once fully operational, its projected FY16-17 net profit could be RM37mil.

Anyway, this is just a rough guess.

From info available online, TGuan's projected net profit for FY16 is RM35mil, RM27mil & RM40mil from RHB, Kenanga & CIMB respectively.

Base on the median projected net profit of RM35mil by RHB, its projected EPS in FY16 will be 33.3sen.

If given a PE ratio of 10x, its target price will be RM3.33!


Nevertheless, this is not the end of the story.

In order to raise fund for the massive expansion, TGuan undertook rights issue of 2 ICULS and 1 warrant for every 4 TGuan's shares in 2014.

This exercise was ex-ed in Sep14 with the listing of 52.6mil ICULS and 26.3mil warrants.

Both ICULS and warrants can be converted to TGuan shares at 1:1 with conversion price of RM1.00 & RM1.50 respectively before they expire in Oct 2019.

All ICULS are mandatory to be converted but holders can only do so after 2 years from listing, which is after Oct 2016.

This potential additional shares of 78.9mil shares is huge with a potential earning dilution of 75%, as TGuan's current outstanding shares are just 105.2mil.

If TGuan's PATAMI can reach RM35mil in FY16, its fully diluted EPS will be 19sen, though in accounting, diluted EPS is not calculated like that.

If its PATAMI stall at RM35mil until FY19, and all the ICULS and warrants are converted into mother shares, then it will not be good.

If I'm sure that its net profit can continue to grow beyond FY16 to FY19, then I will surely invest in it now.

However, no one can predict until year 2019.

Its profit may continue to grow due to penetration into new markets or Tokyo Olympic effect.

Its profit may also drop due to stiff competition, higher operating and raw material cost etc.

It might also implement another round of cash call for further expansion.


TGuan is a growing company with good balance sheet and cash flow.

Earlier this year it suffered significant forex losses due to high USD denominated loans used for expansion.

It has recently pared down its borrowings substantially and I can foresee healthy cash flow in the near future.

Sales to its major export market Japan suffers a bit recently after the increase of VAT (value-added tax) in Japan from 5% to 8%.

However, TGuan still enjoys the largest market share (12%) of garbage bag in Japan.

I think this is a remarkable achievement for a small cap company.

The only thing I don't like is its relatively huge ICULS and warrants.

I do not invest in SAM Engineering because of this similar reason. Just look at SAM now.

Tuesday, 20 October 2015

Pathological Gambler

Recently a "not-so-close" family member called and asked for my help.

She hoped that I can "save" her by lending her a few thousands ringgit.

She is a notorious gambler which is always debt-ridden.

Other family members have helped her to pay off her debts in the past but she somehow will get back into debt again and again.

And she never pay back the money she "borrowed".

What will you do if you were me?

My answer is a definite and firm NO.

If she asks me why, I will tell her the truth that my debts are hundred times more than hers.

I spend the minimum I can everyday, I work hard and save hard for the future of my children and family.

Do you think that I will give her the money to throw into the river?

There are other people who are more deserved to get the money.

To be frank, I hate gambling, even though I am not totally against it.

For me, if you want to gamble, please use your own excess money.

If you borrow to gamble, then you are digging your own grave.

I believe that there are lots of "pathological gamblers" around us.

These are the people who are so addicted to gambling until it becomes a disease or disorder.

Most of them are in the lower socio-economic group such as hawkers, renovation/construction workers, small business owners, drivers, salespersons, operators, housewives etc.

They all have financial difficulty and naturally they want more money. So gambling will be the easiest & fastest way for them to get rich.

If you advise them to save their money every month and learn to invest wisely so that they can have a chance to live comfortably in 20-30 years time, they will laugh at you.

For them, they can have a chance to get rich in few days time, why need to wait for so many years?

Sometimes they win but most of the time they will lose.

They will finally succumb to the euphoria of winning small and just cannot stop from gambling after that.

Since they are basically poor, where to get the money to gamble then?

The easiest way is to borrow, from relatives, friends and even Ah Long.

The fact is, they will lose all the money eventually. What will they do next?

They will borrow again from other people to pay back the earlier creditors, and then gamble again and hope they will have more luck this time.

If the creditors are too kind and not going after them, definitely they will not pay them back. They would rather use any available money to gamble.

More money in means more chances to win.

If you don't have a pathological gambler around you, then you are damn lucky.

I'm not that lucky though. I have a time bomb very very close to me.

I know what those gamblers' behaviours are like.

They will give you one thousand and one reasons on why they need to gamble.

They are expert in telling lies especially when borrowing money and when dealing with creditors.

They will steal when in dire need for money.

They can have more than 10 debtors at a time.

They always make empty promise on quitting gambling.

The best part is, they will never learn. They never learn the fact that the more they gamble, the more they lose.

Even though they are hassled by Ah Long, they will also never learn from that bad experience.

These are what we call "pathological".

Can they be treated with counselling etc? It is easier said that done.

If I rule the country, I will ban gambling.

There will be no casino, Toto, Magnum, online gambling and those stupid internet cafes etc.

Gambling has made the poor poorer, reduced the productivity of our workforce, ruined the future of our teens besides giving rise to so many family and social problems.

How about the stock market?

For me, stock market is a heaven for gambling, but it just cannot be banned, right?

Gambling in the stock market is absolutely legal.

I can foresee that in the near future more and more young people will engage in stock market gambling.

In casino, we play Big & Small. In stock market, we play Up & Down.

People can easily get addicted to this excitement, operated just by a few clicks in front of computers, or a few swipes on the smartphones.

Not enough money to "play" stocks?

No problem. We can legally borrow money to gamble in stock market as well.

Again, I'm not totally against gambling in stock market, as long as one is disciplined enough to control their greed and use only excess money.

Sometimes we read news that gamblers lodge complaints because they are being harassed by Ah Long or their family members want to cut ties with them.

I think they probably deserve that.

Please forgive me for being harsh to such gamblers.

You may not share the same feeling with me may be because you never face such gamblers close to you in real life.

Thursday, 15 October 2015

Investment: Art Or Science?

I believe that investment is a combination of art and science, more of an art.

It's definitely not a straight forward science.

I know that I'm not a knowledgeable investor.

I'm also not a good learner.

Though I use fundamental analysis in stock market investment, my fundamental knowledge is actually very shallow until today.

What I know is something very simple which everyone else knows, PE ratio, ROE, Debt/Equity ratio, dividend yield, EPS growth etc.

So, I'm not a "special one", I'm just a " normal one" :)


I know the importance of some other more accurate financial ratios such as ROIC, Enterprise value, certain cash flow ratios etc but I rarely use them.

I read from books and numerous articles about the importance of intrinsic value and margin of safety in investment but I didn't really apply them.

I did try to learn to calculate fair value of stocks using dividend discount model and discounted cash flow model. 

However, when I realize how the fair values are derived, I straight away gave up. This is because the calculation is based on lots of assumption.

Please don't get me wrong. I don't mean that intrinsic value calculation with DDM and DCF model do not work.

Actually they have been proven to be useful and important in value investing throughout the world.

Some may think that I am too "cocky" to ignore all those proven investment methods and do it all my way. It's OK. I'm not that great as most of you think.

Everyone has their own investment style and I'm applying what suits me the most at this point of time.

So far I really find it difficult to put DCF into my brain.

My investment style changes with time. There have been quite a lot of changes throughout these years.

I notice that there is some small but significant changes this year. Has anyone notice that I seldom talk about things like ROE, EPS growth, DY recently?


For me, stock market investment is a game of prediction. I predict the growth, the strength and the sustainability of a business. 

As most of the time I plan for longer term investment, a sustainable business in mid to long term is important.

Growth - can the sales and profit improve?
Strength - is the company competitive? can it survive a downfall?
Sustainability - can the business and the company last long?

As fundamental investors, we all try to make an intelligent guess on a company's future, or the share price movement for those speculators.

While I'm not calculating intrinsic value with DCF/DDM method, I'm actually still looking into the company's cash flow, as well as balance sheet when choosing a company for investment.

If the company has lousy balance sheet with high debts and low quality assets, how can it survive a downfall or last long?

If the company has poor cash flow especially poor free cash flow, how good a balance sheet can it has and how long can it last?

If the company has poor ROE, has high debts but it gives signs of growth and its cash flow is improving (like Hevea some time ago), it is still a good candidate for investment.

So it's not necessary to get the ROE box ticked before putting my money in a company.

It is not easy to find a perfect company that tick all the boxes.

If there is, its share price should be imperfect.

The "margin of safety" I'm using is PE ratio. If I want to be safer, I will use lower PE ratio as an entry point.

Anyway, PE ratio is not flawless of course. Just look at most property stocks' PE ratio at the moment.


I don't have a formula to pick a stock for investment. It is all based on the "right feel".

That's why investment is more of an art for me.

People are like this, we are scientific people and we want to have everything in order and make everything more simple.

So we come up with various magic formulas in investment.

This makes investment more like a science rather than an art, if you follow the formulas rigidly.

Again, I'm not saying that these formulas are useless. Certainly they have helped many investors to make good and correct decisions in investment.

I cannot rule out that I will use these formulas or calculate intrinsic value in the future.

Everyone has their own opinions and investment styles.

There is no need to condemn others if their views are different from ours.

Tuesday, 6 October 2015

Scientex: Another Record Year In FY15

Scientex FY15Q4 Financial Result

SCIENTEX FY15Q4 FY15Q3 FY15Q2 FY15Q1 FY14Q4
Revenue 452.5 455.3 462.9 431.1 415.4
Operating Profit 77.1 58.4 48.0 41.5 56.2
OP% 17.0 12.8 10.4 9.6 13.5
PBT 77.0 56.5 47.3 40.2 56.0
PBT% 17.0 12.4 10.2 9.3 13.5
PATAMI 48.9 42.9 36.1 30.3 48.8


Manu Rev 319.9 318.8 327.0 320.3 297.3
Manu OP 24.7 20.0 17.4 14.7 18.8
Prop Rev 132.6 136.5 135.9 110.8 118.1
Prop OP 61.6 41.5 40.3 32.0 36.9


Total Equity 1004.8 851.6 808.6 769.8 712.7
Total Assets 1637.8 1488.9 1533.3 1475.8 1400.4
Trade Receivables 321.7 325.2 340.2 303.2 243.5
Inventories 112.0 85.9 81.3 83.7 109.0
Cash 90.6 63.5 121.7 102.9 83.8
Prop Dev Cost 136.5 110.5 117.0 104.0 104.6


Total Liabilities 633.0 593.7 681.4 664.7 665.0
Trade Payables 308.3 255.6 232.1 246.6 272.1
ST Borrowings 149.9 202.5 311.4 297.9 262.9
LT Borrowings 75.5 80.2 50.2 66.6 77.5


Net Cash Flow 6.9 -20.3 38.0 19.1 -68.4
Operation 189.9 93.2 16.4 1.5 153.5
Investment -37.2 -29.6 -4.0 13.2 -149.2
Financing -145.8 -83.9 25.5 4.5 -72.7


Dividend paid 47.1 47.1 17.7 17.7 57.5


EPS 21.66 19.02 15.98 13.69 22.09
NAS 4.17 3.77 3.58 3.47 3.22
D/E Ratio 0.13 0.26 0.30 0.34 0.36


Scienex's FY15Q4's revenue is lower by RM2.8mil QoQ but PATAMI is higher by RM6.0mil. There is a pre-tax revaluation gain of RM12.6mil and a net forex loss of RM7.3mil in this quarter.

Current quarter's tax rate is abnormally high at 35.3% due to timing of deferred tax recognition. If given normal tax rate, its PATAMI in FY15Q4 should reach RM57mil.

For the whole FY15, revenue increases 13.3% to RM1.80bil while PATAMI inches up 6.5% to RM158.2mil.

This result includes a revaluation gain of RM12.6mil as mentioned earlier in its property segment, as well as a forex loss of RM27.2mil in its manufacturing segment.

Its balance sheet remain clean with a net debt/equity ratio of just 0.13 while cash flow from operation is nothing but excellent.


SCIENTEX FY15 FY14 FY13 FY12 FY11 FY10
Revenue 1801.7 1590.5 1229.0 881.0 804.0 694.8
Revenue growth % 13.3 29.4 39.5 9.6 15.7
PBT 221.0 182.3 143.0 107.2 96.6 70.8
PBT% 12.3 11.5 11.6 12.2 12.0 10.2
PATAMI 158.2 148.5 110.3 83.9 77.2 60.3
PATAMI growth % 6.5 34.6 31.4 8.7 28.0


EPS 70.43 67.12 51.00 39.00 35.90 28.00
NTA 4.17 3.22 2.84 2.44 2.17 1.92
ROE 15.7 20.8 17.5 16.0 16.5 14.6
DPS            22.0 21.0 26.0 14.0 12.0 9.0


The massive realized forex loss in FY15 is due to extensive pare down of its USD denominated loans by 80% to RM55.9mil, from RM280mil a year ago.


The bar chart below shows quarterly net forex loss realized by Scientex in FY2015.

This net forex loss of RM22.3mil is not a small amount. It is higher than whole year PATAMI of Prolexus in FY15 for example.


Apart from those exceptional gain & loss, Scientex's business is growing well to another record high in FY15.

Revenue from manufacturing segment grows 8.4% from RM1.19bil in FY14 to RM1.29bil, while operating profit increases 18% from RM64.9mil to RM76.8mil.

Its gross and EBITDA margin has improved compared to last financial year.


Revenue from property segment rises 29.5% from RM398mil to RM516mil, while operating profit jumps 45% from RM120.9mil to RM175.4mil which include a RM12.6mil revaluation gain.


Looking forward, Scientex's manufacturing segment especially its consumer packaging division is expected to grow by leaps and bounds in the next two FYs.


Its CPP film plant has been completed in Aug15 and is on track to start production by end of CY2015.

Further expansion of PE film annual capacity by 12,000MT (additional 3 lines) and the new BOPP film plant in Pulau Indah are expected to start running in mid-2016.

Besides, Scientex has acquired Mondi Ipoh in Aug15 which has annual capacity of 14,400MT for RM58mil.

Mondi Ipoh exports 70% of its products which include bakery bags, hygiene products packaging, form-fill-seal bags etc.

          Form-fill-seal machine

Net profit of Mondi Ipoh in 2014 is just RM0.14mil but there is a one-off gratuity payment of RM2.7mil.

Anyway, more importantly this acquisition will widen Scientex's product range and customers.

With all these expansion plans on track, the average monthly sales of its consumer packaging products is expected to jump by 3x in 2 years time.


In contrary, its property segment is expected to face some headwinds due to sluggish property market.

Overall property sales in FY15 is RM606mil according to RHB but Kenanga reported it as RM515.7mil. I'm not sure who is correct.

Anyway, these 2 figures are still higher than FY14 property sales of RM470mil.

Unbilled sales stood at RM585mil at end of Jul15, down slightly from RM599mil a quarter ago but still higher than RM537mil a year ago. Unbilled sales has increased to RM620mil in Aug15.

Scientex plans to launch RM600mil worth of property in its FY16 in which most of them are in affordable range less than RM500k.

It is also in the process to acquire 326 acres of land in Pulai for RM219mil.


Meanwhile, Futamura Chemicals Co. (FCC) has exercised its option to acquire another 5% shares in Scientex Great Wall (SGW) in Jul15 for RM40mil.

FCC currently holds 10% shares in SGW and has an option to acquire 20% of SGW. All of Scientex's consumer packaging businesses are incorporated under SGW. I do hope that FCC will stop here but I think it is unlikely.

Scientex has declared a final dividend of 13sen making it total 22sen with 31.4% payout in FY15. This represents a yield of 3% at share price of RM7.40.

At FY15 EPS of 70.43, Scientex is currently traded at actual PE ratio of 10.5x.

This EPS of 70.43 is not core profit of Scientex. Though most analysts give a core profit which is lower than its PATAMI of RM158.2mil, I think otherwise as I will only simply take into account the revaluation gain (RM12.6mil) and forex loss (RM27.2mil).

As the BOPP film plant will only be completed in mid 2016 which might be delayed, and its property segment might experience negative growth, I will be happy if its FY16 results match FY15.

I do expect a slight growth though due to expected lower forex loss in FY16, even though new facilities will incur higher depreciation charge.

I have hold Scientex for 2 years now and its share price has appreciated by 36%. This is actually not good enough compared to many other stocks which have doubled or tripled in this period of time.

Anyway, there is no doubt that Scientex is a great company to hold for long term.