Showing posts with label Scientex. Show all posts

Sunday, 14 July 2024

My Portfolio Jun24

Summary For June 24


Portfolio @ End of Jun24


Jun24 doesn't feel like a good month to me and I thought my portfolio will register loss in the month before I did my monthly calculation.

Surprisingly it still manage to gain 3.5%.

This is because the good run in the first half of Jun24 was not totally undone by the bad second half.

Anyway, KLCI still lost 0.4%.

Overall, my YTD gain inched up to 39%.


Friday, 12 April 2024

My Portfolio Mac24

Summary For March 2024


Portfolio @ End of Mac24 


In Mac24, the two newly added stocks ADB & EUPE performed brightly as they rose 37.6% and 9.3% respectively.

This has helped to propel my portfolio to gain 1.6% in Mac24. YTD gain improves slightly to 8.1%.

The share price of ADB inched up almost everyday and I have no chance to add more shares. Thus it only contributes rather minimally to my portfolio despite appreciated 35%.

Meanwhile, the share price of EUPE took a break below RM1 so I took this opportunity to buy more of its shares, with a target price of RM2.


Thursday, 13 July 2023

My Portfolio Jun23

 Summary For June 2023


Portfolio @ End of Jun23


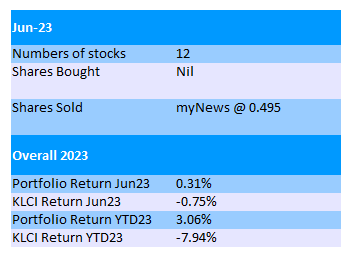
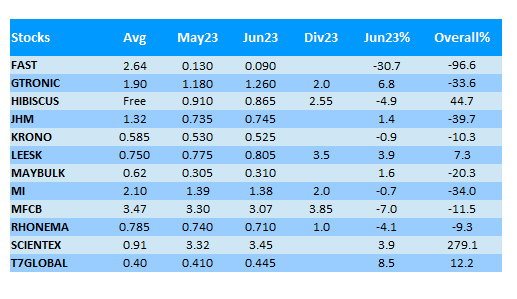
My portfolio is rather flat in Jun23 with a marginal gain of 0.3%. Overall YTD still manage to stay in the positive territory of 3.1%.

T7Global started to make some move this month with a sudden surge from 41.5sen to 47.5sen in mid June, only to retreat to 44.5sen at the end of Jun23.

Gtronic made good progress as well with a 6.8% gain in the month.

However, MFCB dropped by as much as 7.0% in June which was somewhat unexpected to me. 

I thought MFCB's share price should be as steady as rock even if growth might be slow. It has dropped from RM3.60 to almost RM3.00 since earlier this year.


Sunday, 8 January 2023

My Portfolio Dec22

 Summary For December 2022


Stock Portfolio @ End of Dec22


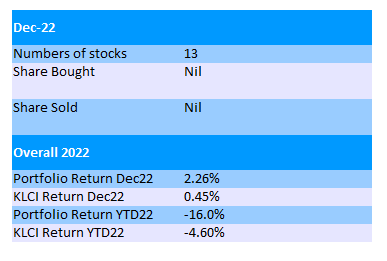
Year 2022 didn't end with a bang as many investors have hoped for. KLCI inched up only 0.45% in Dec22 while my portfolio improved by only 2.2%.

Overall for the whole year of 2022 my portfolio suffered a 16% loss. This is the second worst annual loss since losing 28.8% in 2018.

Meanwhile, KLCI ended year 2022 with a loss of 4.6% which is worse than 3.7% loss registered in 2021.

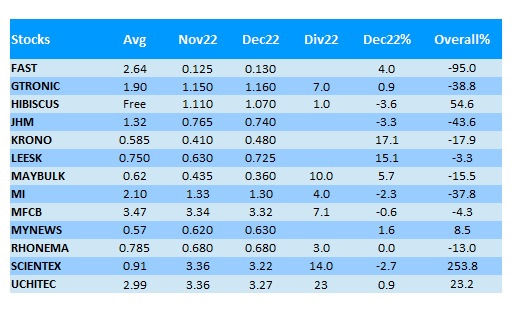
Most of the share price of stocks in my portfolio remain quite stable in December, with the exception of Krono & LeeSK which rallied 17% and 15% respectively.

Maybulk dropped from RM0.435 to RM0.36 but there was a 10sen special dividend ex-ed in the month.


Tuesday, 18 October 2022

My Portfolio Sep22

 Summary For September 2022


Portfolio @ End of Sep22


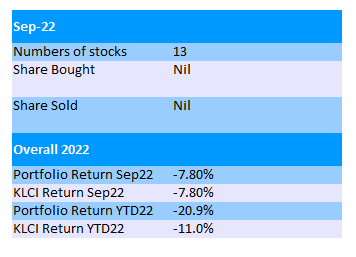
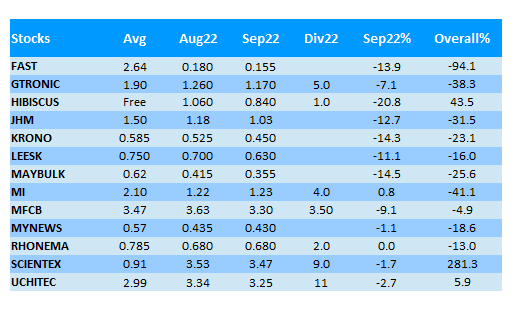
The month of September is not a good month for stock market after a brief rebound in August. KLCI tumbled 7.8%, exactly the same as the performance of my portfolio in Sep22.

The worst performer is Hibiscus, which fell 21% in one month, followed by Maybulk, Krono, JHM & LeeSK which suffered more than 10% loss.

Overall year-to-date, accumulated loss since the start of the year has reached 20% for the first time.

Three companies in my portfolio announced their quarter results in September.

Krono's FY23Q2's result (PAT RM3.1mil, EPS 0.44) is not within my expectation, but not too bad either. Net profit increased 40% QoQ but dropped 40% YoY.

However, YoY, the EBIDTA in this quarter was comparable at RM10.5mil. The net profit was mainly dragged down by 30% higher depreciation charge.

Contribution from EDM infrastructure technology segment is still weak in the first half of FY23. Whether it can play catch up in the remainder of FY23 remains to be seen.


Monday, 4 April 2022

My Portfolio Mac22


Summary For March 2022


Portfolio @ End of Mac22


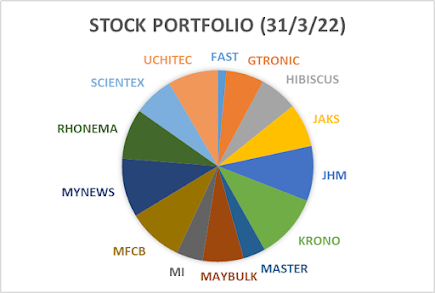
After a challenging month of Feb22, Mac22 was a volatile month for tech-related stocks in Bursa in which they fell heavily in the first week but then staged a V-shape recovery.

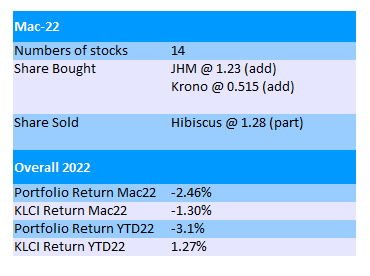
I just added a bit of Krono and JHM during this period of time. I still haven't averaged down on MI as its share price has already rebounded strongly before I made my move.

I planned to add MI's shares at RM1.50 but it didn't reach this level even though it was close.

In Mac, my portfolio suffered a 2.5% loss. Year-to-date the loss has widened to 3%.

Oil & gas stocks especially upstream Hibiscus have the exact opposite fate as the tech stocks.

The share price of Hibiscus rallied since the end of Jan22 from RM0.88 to reach RM1.38 on 9th Mac22, before falling 26% to almost RM1 in the next 4 days.

I sold my second batch of Hibiscus shares at RM1.28. I keep the rest to see how the market will respond to its upcoming quarter result which includes approximately 2 months contribution from acquired Repsol assets.


Monday, 4 October 2021

My Portfolio Sep21


Summary For September 2021


My Portfolio @ End of Sep21


The performance of the stocks in my portfolio in September is mixed, with nine gains and nine losses.

Overall my portfolio lost 1.2% in this month.

The worst performer is Supermax which suffered a 27.5% drop. I didn't follow its share price closely and was actually quite shocked to realize how low it has gone.

Nevertheless Supermax has a 15-sen dividend ex-ed in Sep21.

Even though I don't have a lot of Supermax shares, it's still a disappointment to me. 

On the other hand, the best performer is DKSH which gains 19% but I also do not own a lot of its shares.

Sunday, 4 July 2021

My Portfolio Jun21


Summary For Jun21


Stock Portfolio @ End of Jun21

My Portfolio registered 5.3% loss in the month of June, mainly "contributed" by the huge drop in SCIB, SCIB-WB, and to some extent, JAKS.

Overall year-to-date return has dropped to merely 2.3%.

I have sold part of SCIB's shares again this month at 77.5sen. Initially I planned to sell all of its shares and warrants to wrap up my investment in it, but last minute I changed my mind and sold only half of the remaining mother shares.

However, its share price continue to drop to 50sen, below my average price of 54.5sen

Anyway, SCIB has finally released its FY21Q1 result which was a bit of relief to me even though the result was slightly below my expectation.

So far there is still no mention of any accounting issue by its external auditor KPMG.

Wednesday, 23 September 2020

The Legends: QL vs Scientex


What is the first thing that crosses your mind when someone mentions about QL?

  1. A company that sells seafood
  2. A company that sells chicken and eggs
  3. A company that operates Family Mart
  4. A company that grows its revenue and profit annually without fail for more than 10 years
I think most investors with a few years of experience in Malaysia stock market will choose no.4.

Yes, QL is a "legendary" stock in Malaysia which has registered annual revenue and net profit growth every year without fail for at least 17 years (my available data is from FY2003).

It is commonly used as a reference when people talk about fundamental long term investment, consistent growth story and good management team.

While QL is no doubt a great company, how about Scientex? 

Friday, 18 December 2015

Scientex: Expects FY16 Performance To "Normalise"?

Scientex FY16Q1 Financial Result

SCIENTEX (RM mil) FY16Q1 FY15Q4 FY15Q3 FY15Q2 FY15Q1
Revenue 550.6 452.5 455.3 462.9 431.1
Operating Profit 82.1 77.1 58.4 48.0 41.5
OP% 14.9 17.0 12.8 10.4 9.6
PBT 80.8 77.0 56.5 47.3 40.2
PBT% 14.7 17.0 12.4 10.2 9.3
PATAMI 60.9 48.9 42.9 36.1 30.3


Manu Rev 392.0 319.9 318.8 327.0 320.3
Manu OP 38.0 24.7 20.0 17.4 14.7
Prop Rev 158.6 132.6 136.5 135.9 110.8
Prop OP 47.5 61.6 41.5 40.3 32.0


Total Equity 1007.6 1004.8 851.6 808.6 769.8
Total Assets 1818.5 1637.8 1488.9 1533.3 1475.8
Trade Receivables 404.8 321.7 325.2 340.2 303.2
Inventories 110.1 112.0 85.9 81.3 83.7
Cash 79.7 90.6 63.5 121.7 102.9
Prop Dev Cost 139.8 136.5 110.5 117.0 104.0


Total Liabilities 744.8 633.0 593.7 681.4 664.7
Trade Payables 336.1 308.3 255.6 232.1 246.6
ST Borrowings 253.0 149.9 202.5 311.4 297.9
LT Borrowings 70.0 75.5 80.2 50.2 66.6


Net Cash Flow -10.9 6.9 -20.3 38.0 19.1
Operation 63.3 189.9 93.2 16.4 1.5
Depreciation 13.5 11.4 11.0 10.7 10.7
Investment -117.7 -37.2 -29.6 -4.0 13.2
PPE purchase 117.3 100.0 54.3 18.8 5.1
Financing 43.6 -145.8 -83.9 25.5 4.5
FCF -54.0 89.9 38.9 -2.4 -3.6


EPS 26.97 21.66 19.02 15.98 13.69
NAS 4.46 4.17 3.77 3.58 3.47
D/E Ratio 0.24 0.13 0.26 0.30 0.34


Scientex has released its latest FY16Q1 result which saw its PATAMI jumped by 100% YoY. It is yet another record high quarter in revenue and net profit by a wide margin.

The next day, The Edge website came out with this article:


After achieving its best ever financial result in FY16Q1, Scientex expects FY16 performance to "normalise".

I guess most people will straight away think that this FY16Q1 is extraordinary and non-sustainable, and it will fall back to its "normal" level in the rest of FY16.

Actually it is not, it is the other way round.

Scientex record-breaking FY15 was hit by forex loss and higher tax rate. In FY16, all these will "normalise", which means that it will have less forex loss & usual tax rate, which also means that if its sales in FY16 remain the same as in FY15, it will enjoy higher profit.

Will Scientex's FY16 sales stay the same as FY15?


Its new CPP plant (12,000MT p.a) is set to start commercial production by end-2015.

Its BOPP plant (60,000MT p.a) is 90% completed and is on track to commence operation by mid-2016.

Its 20% expansion in PE film to 74,400MT p.a is also set to be completed in mid-2016.

How much revenue can Scientex generate in its FY16? I thnik it will be more than FY15 even though those expansion may only make meaningful contribution from FY17 onward (from Aug16).

Nevertheless, net profit generated is hard to predict as there might be higher start up cost and also depreciation charge.

SGW Ipoh (Mondi) which was acquired in Aug15 contributed about RM40mil in revenue in this quarter.

Without contribution of SGW Ipoh, its manufacturing revenue and profit will still hit a record high.

It will benefit from strong USD as 70% of its products are exported.

Property division continue to do well, despite lower profit QoQ as there was a revaluation gain of RM12.6mil in previous quarter.

Unbilled sales increased to RM632.2mil at the end of FY16Q1, compared to RM585mil 3 months ago.


Scientex's CEO said that the company will allocate as much as RM460mil for capex in FY16, which include RM200mil for property division.

For comparison, the company just spent RM100mil on PPE purchase in FY15.

In the first quarter of FY16, RM117mil has already been spent for PPE purchase, which include about RM54mil in the acquisition of SGW (Mondi) Ipoh.

It has plan to expand the capacity of SGW Ipoh later in 2016, and will continue to grow its packaging division by acquisition.

Of course its cash flow is "poor" temporarily due to the aggressive expansion, and its net gearing ratio has increased to 0.24.

The CEO mentioned in The Edge that FY16 will see BETTER RESULTS and BETTER OPERATING CASH FLOW.

Its operating cash flow in FY15 was approximately RM200mil.

After the announcement of latest result, Scientex's share price surged from RM8.60 to RM9.50 in 2 days time.

Is Scientex "expensive" now?

Personally I think it is not unfair to annualise its FY16Q1 EPS of 27sen, don't you think so?


Tuesday, 6 October 2015

Scientex: Another Record Year In FY15

Scientex FY15Q4 Financial Result

SCIENTEX FY15Q4 FY15Q3 FY15Q2 FY15Q1 FY14Q4
Revenue 452.5 455.3 462.9 431.1 415.4
Operating Profit 77.1 58.4 48.0 41.5 56.2
OP% 17.0 12.8 10.4 9.6 13.5
PBT 77.0 56.5 47.3 40.2 56.0
PBT% 17.0 12.4 10.2 9.3 13.5
PATAMI 48.9 42.9 36.1 30.3 48.8


Manu Rev 319.9 318.8 327.0 320.3 297.3
Manu OP 24.7 20.0 17.4 14.7 18.8
Prop Rev 132.6 136.5 135.9 110.8 118.1
Prop OP 61.6 41.5 40.3 32.0 36.9


Total Equity 1004.8 851.6 808.6 769.8 712.7
Total Assets 1637.8 1488.9 1533.3 1475.8 1400.4
Trade Receivables 321.7 325.2 340.2 303.2 243.5
Inventories 112.0 85.9 81.3 83.7 109.0
Cash 90.6 63.5 121.7 102.9 83.8
Prop Dev Cost 136.5 110.5 117.0 104.0 104.6


Total Liabilities 633.0 593.7 681.4 664.7 665.0
Trade Payables 308.3 255.6 232.1 246.6 272.1
ST Borrowings 149.9 202.5 311.4 297.9 262.9
LT Borrowings 75.5 80.2 50.2 66.6 77.5


Net Cash Flow 6.9 -20.3 38.0 19.1 -68.4
Operation 189.9 93.2 16.4 1.5 153.5
Investment -37.2 -29.6 -4.0 13.2 -149.2
Financing -145.8 -83.9 25.5 4.5 -72.7


Dividend paid 47.1 47.1 17.7 17.7 57.5


EPS 21.66 19.02 15.98 13.69 22.09
NAS 4.17 3.77 3.58 3.47 3.22
D/E Ratio 0.13 0.26 0.30 0.34 0.36


Scienex's FY15Q4's revenue is lower by RM2.8mil QoQ but PATAMI is higher by RM6.0mil. There is a pre-tax revaluation gain of RM12.6mil and a net forex loss of RM7.3mil in this quarter.

Current quarter's tax rate is abnormally high at 35.3% due to timing of deferred tax recognition. If given normal tax rate, its PATAMI in FY15Q4 should reach RM57mil.

For the whole FY15, revenue increases 13.3% to RM1.80bil while PATAMI inches up 6.5% to RM158.2mil.

This result includes a revaluation gain of RM12.6mil as mentioned earlier in its property segment, as well as a forex loss of RM27.2mil in its manufacturing segment.

Its balance sheet remain clean with a net debt/equity ratio of just 0.13 while cash flow from operation is nothing but excellent.


SCIENTEX FY15 FY14 FY13 FY12 FY11 FY10
Revenue 1801.7 1590.5 1229.0 881.0 804.0 694.8
Revenue growth % 13.3 29.4 39.5 9.6 15.7
PBT 221.0 182.3 143.0 107.2 96.6 70.8
PBT% 12.3 11.5 11.6 12.2 12.0 10.2
PATAMI 158.2 148.5 110.3 83.9 77.2 60.3
PATAMI growth % 6.5 34.6 31.4 8.7 28.0


EPS 70.43 67.12 51.00 39.00 35.90 28.00
NTA 4.17 3.22 2.84 2.44 2.17 1.92
ROE 15.7 20.8 17.5 16.0 16.5 14.6
DPS            22.0 21.0 26.0 14.0 12.0 9.0


The massive realized forex loss in FY15 is due to extensive pare down of its USD denominated loans by 80% to RM55.9mil, from RM280mil a year ago.


The bar chart below shows quarterly net forex loss realized by Scientex in FY2015.

This net forex loss of RM22.3mil is not a small amount. It is higher than whole year PATAMI of Prolexus in FY15 for example.


Apart from those exceptional gain & loss, Scientex's business is growing well to another record high in FY15.

Revenue from manufacturing segment grows 8.4% from RM1.19bil in FY14 to RM1.29bil, while operating profit increases 18% from RM64.9mil to RM76.8mil.

Its gross and EBITDA margin has improved compared to last financial year.


Revenue from property segment rises 29.5% from RM398mil to RM516mil, while operating profit jumps 45% from RM120.9mil to RM175.4mil which include a RM12.6mil revaluation gain.


Looking forward, Scientex's manufacturing segment especially its consumer packaging division is expected to grow by leaps and bounds in the next two FYs.


Its CPP film plant has been completed in Aug15 and is on track to start production by end of CY2015.

Further expansion of PE film annual capacity by 12,000MT (additional 3 lines) and the new BOPP film plant in Pulau Indah are expected to start running in mid-2016.

Besides, Scientex has acquired Mondi Ipoh in Aug15 which has annual capacity of 14,400MT for RM58mil.

Mondi Ipoh exports 70% of its products which include bakery bags, hygiene products packaging, form-fill-seal bags etc.

          Form-fill-seal machine

Net profit of Mondi Ipoh in 2014 is just RM0.14mil but there is a one-off gratuity payment of RM2.7mil.

Anyway, more importantly this acquisition will widen Scientex's product range and customers.

With all these expansion plans on track, the average monthly sales of its consumer packaging products is expected to jump by 3x in 2 years time.


In contrary, its property segment is expected to face some headwinds due to sluggish property market.

Overall property sales in FY15 is RM606mil according to RHB but Kenanga reported it as RM515.7mil. I'm not sure who is correct.

Anyway, these 2 figures are still higher than FY14 property sales of RM470mil.

Unbilled sales stood at RM585mil at end of Jul15, down slightly from RM599mil a quarter ago but still higher than RM537mil a year ago. Unbilled sales has increased to RM620mil in Aug15.

Scientex plans to launch RM600mil worth of property in its FY16 in which most of them are in affordable range less than RM500k.

It is also in the process to acquire 326 acres of land in Pulai for RM219mil.


Meanwhile, Futamura Chemicals Co. (FCC) has exercised its option to acquire another 5% shares in Scientex Great Wall (SGW) in Jul15 for RM40mil.

FCC currently holds 10% shares in SGW and has an option to acquire 20% of SGW. All of Scientex's consumer packaging businesses are incorporated under SGW. I do hope that FCC will stop here but I think it is unlikely.

Scientex has declared a final dividend of 13sen making it total 22sen with 31.4% payout in FY15. This represents a yield of 3% at share price of RM7.40.

At FY15 EPS of 70.43, Scientex is currently traded at actual PE ratio of 10.5x.

This EPS of 70.43 is not core profit of Scientex. Though most analysts give a core profit which is lower than its PATAMI of RM158.2mil, I think otherwise as I will only simply take into account the revaluation gain (RM12.6mil) and forex loss (RM27.2mil).

As the BOPP film plant will only be completed in mid 2016 which might be delayed, and its property segment might experience negative growth, I will be happy if its FY16 results match FY15.

I do expect a slight growth though due to expected lower forex loss in FY16, even though new facilities will incur higher depreciation charge.

I have hold Scientex for 2 years now and its share price has appreciated by 36%. This is actually not good enough compared to many other stocks which have doubled or tripled in this period of time.

Anyway, there is no doubt that Scientex is a great company to hold for long term.