Matrix FY14Q2 Financial Result
| MATRIX | FY14Q2 | FY14Q1 | FY13Q4 | FY13Q3 | FY13Q2 |
| Revenue | 163.7 | 134.7 | 144.3 | 127.4 | 147.3 |
| PBT | 58.6 | 54.0 | 56.4 | 48.7 | 40.6 |
| PBT% | 35.8 | 40.1 | 39.1 | 38.2 | 27.6 |
| PATAMI | 42.4 | 38.6 | 40.7 | 36.2 | 30.0 |
| Res & Com Prop % | 74.1 | 66.7 | 76.0 | ||
| Industrial Prop % | 20.8 | 27.8 | 21.0 | ||
| Industrial Land % | 5.1 | 5.5 | 3.0 | ||
| Total Equity | 613.5 | 582.0 | 552.4 | 540.1 | 518.3 |
| Total Assets | 944.5 | 964.5 | 900.5 | 862.8 | 793.0 |
| Trade Receivables | 160.0 | 144.3 | 140.8 | 161.5 | 118.1 |
| Prop dev cost | 524.4 | 523.5 | 443.8 | 362.4 | 400.0 |
| Inventories | 0.7 | 0.7 | 1.6 | 1.4 | 2.6 |
| Cash -OD | 29.4 | 96.0 | 83.8 | 211.2 | 206.5 |
| Total Liabilities | 331.1 | 382.5 | 348.1 | 322.7 | 274.7 |
| Trade Payables | 253.7 | 299.3 | 245.7 | 229.5 | 198.3 |
| ST Borrowings | 32.2 | 34.4 | 35.5 | 36.7 | 8.8 |
| LT Borrowings | 1.5 | 13.2 | 15.3 | 15.5 | 16.1 |
| Net Cash Flow | -39.4 | 27.2 | 53.4 | 180.8 | 176.1 |
| Operation | 68.8 | 85.6 | 39.7 | 120.7 | 65.2 |
| Investment | -55.7 | -29.4 | -69.2 | -37.7 | -17.0 |
| Financing | -52.5 | -29.0 | 82.9 | 97.8 | 127.9 |
| EPS | 14.00 | 12.80 | 13.50 | 12.10 | 13.10 |
| NAS | 2.02 | 1.92 | 1.83 | 1.80 | 1.73 |
| D/E Ratio | 0.01 | Net cash | Net cash | Net Cash | Net cash |
Matrix has achieved its best ever quarterly result since listed in May 2013. Compared QoQ, revenue up 21.5% and PATAMI improves 9.8%.
Overall first half's PATAMI at RM81mil is 6.6% better than previous year's corresponding period even though revenue takes a slight dip due to less land sales.
Total sales in 1HFY14 are only RM291mil with RM18.9mil of it comes from industrial land sales. Matrix has launched RM409mil worth of projects in the first half, with a higher new target launch of RM819mil in FY14. It will launch another RM410mil new projects in 2HFY14.
If we compare to overall sales of RM788mil in FY13, current sales level is quite discouraging. However, it is expected to pick up in 2HFY14 due to more land sales and decent response to its recent launch in Bandar Sri Sendayan.
Unbilled sales of RM434.7mil at mid-FY14 is slightly lower than RM440.8mil 3 months ago.
For its balance sheet, free cash level (minus bank overdraft) falls substantially to only RM29.4mil, mainly due to land purchase & repayment of loan, apart from the hefty dividend paid to shareholders. Anyway, cash flow from operation remains healthy.
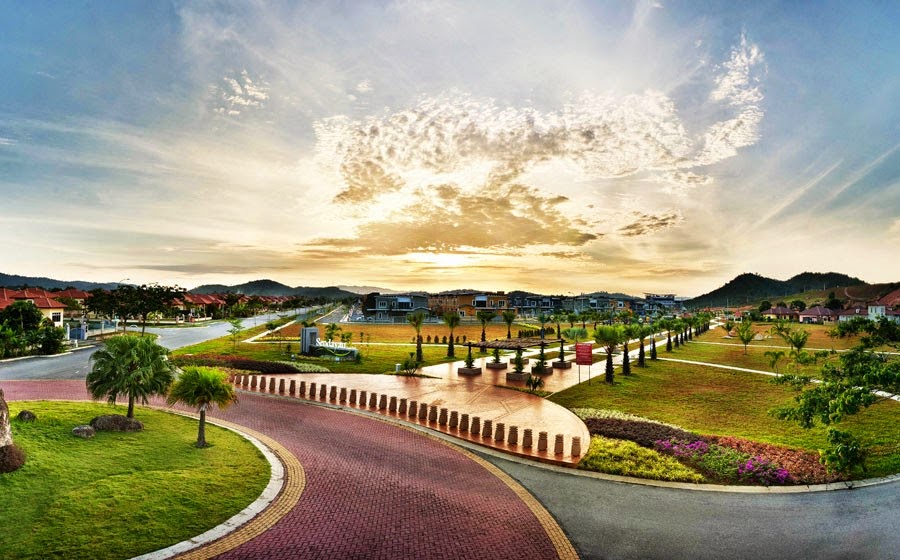
Sendayan Green Park
Matrix declares a second interim single tier dividend of 3.75sen, making it 8.75sen for FY14 so far.
This 3.75sen per share looks lower compared to 5sen first interim dividend for FY14 and 5.25sen (after tax) in the same period last year. If adjusted to recent 1:2 bonus issue, this 3.75sen will be equivalent to 5.625 sen before bonus issue.
I would expect a total 17.5sen dividend for FY14, base on 50% payout ratio from guesstimated FY14 PATAMI of RM160mil.
The first 2 interim dividends are at 7.08sen (1st dividend adjusted to 3.33sen), which means there is still 10.4sen to go. This makes its dividend yield at 5.5% at current share price of RM3.20.
If it pays out only 40% which is its minimum payout, then overall dividend will be 14sen and it is still about 7sen to go. Dividend yield is still at a good 4.4%.
At this guesstimated earning level, projected EPS for FY14 will be 35sen. So my target price for Matrix is RM3.50 base on PE ratio of 10x.

No comments:
Post a Comment